
Welcome to my profile! I’m a Computer Science Engineer (PhD) with extensive experience in data analysis, especially in the healthcare industry.
You can find more of my work and projects on my GitHub.
For more details on my publications, please visit my Google Scholar profile.
Feel free to connect with me on LinkedIn.
Background
With over 10 years of experience in data analysis, I specialize in:
Automating medical data workflows
Transforming clinical data
Building medical monitoring systems
I have extensive knowledge in handling both structured and unstructured healthcare data, focused on improving data quality and developing systems for clinical decision support.
Project
The main objective of this project is to develop a Seizure Monitoring System that can detect and analyze epileptic activity. Epileptic seizures are caused by sudden bursts of electrical activity in the brain, often resulting from imbalances in neurotransmitter levels. These seizures can be triggered by various factors, and understanding their onset and progression is essential for accurate diagnosis and effective treatment.
This project focuses on the detection of specific biomarker known as “chirp” in electrographic data. These biomarkers are consistently present during epileptic episodes and exhibit distinct frequency modulation patterns in the electrographic discharges. The identification of these patterns can serve as reliable indicators for advancing seizure detection technologies and improving patient outcomes.
The main objective of this project is to develop a Seizure Monitoring System that can detect and analyze epileptic activity. Epileptic seizures are caused by sudden bursts of electrical activity in the brain, often resulting from imbalances in neurotransmitter levels. These seizures can be triggered by various factors, and understanding their onset and progression is essential for accurate diagnosis and effective treatment.
This project focuses on the detection of specific biomarkers known as “chirp” in electrographic data. These biomarkers are consistently present during epileptic episodes and exhibit distinct frequency modulation patterns in the electrographic discharges. The identification of these patterns can serve as reliable indicators for advancing seizure detection technologies and improving patient outcomes.
For a detailed explanation of the “chirp” pattern and its significance in seizure detection, please refer to my published research.
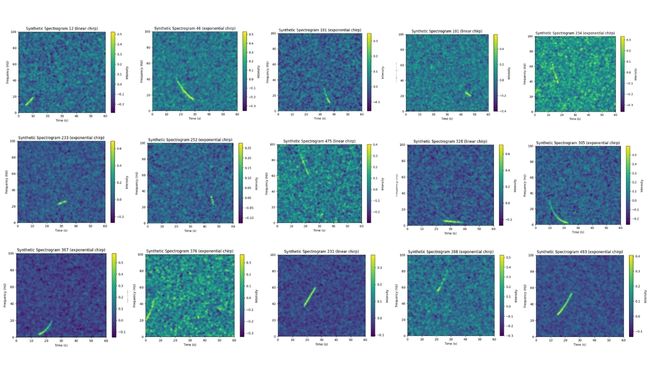
100,000 Labeled Chirp Spectrogram Images – Download on Hugging Face!
Curated by Nooshin Bahador |
Funded by Canadian Neuroanalytics Scholars Program
Citation Bahador, N., & Lankarany, M. (2025). Chirp localization via fine-tuned transformer model: A proof-of-concept study. arXiv preprint arXiv:2503.22713. [PDF]
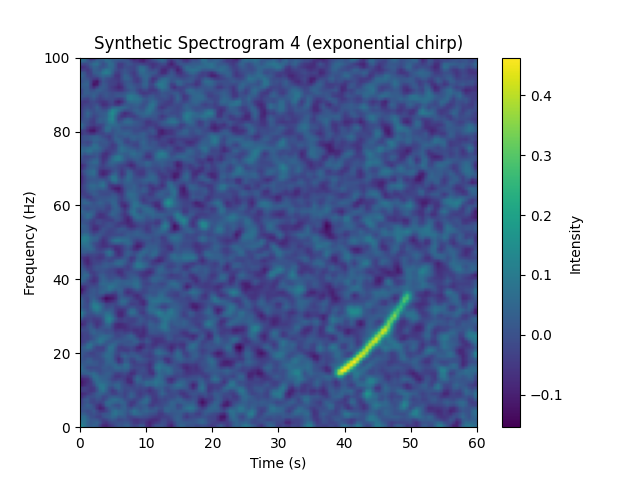
Sample Generated Spectrogram
Sample Generated Label
| Chirp Start Time (s) | Chirp Start Freq (Hz) | Chirp End Freq (Hz) | Chirp Duration (s) | Chirp Type |
|---|---|---|---|---|
| 38.92107594 | 14.58740744 | 36.84728556 | 10.80687464 | exponential |
Fine-Tuning Vision Transformer (ViT) with LoRA for Spectrogram Regression
| Category | Specification |
|---|---|
| Framework | PyTorch |
| Architecture | Pre-trained Vision Transformer (ViT) |
| Adaptation Method | LoRA (Low-Rank Adaptation) |
| Task | Regression on time-frequency representations |
| Target Variables | 1. Chirp start time (s) 2. Start frequency (Hz) 3. End frequency (Hz) |
| Training Protocol | • Automatic Mixed Precision (AMP) • Early stopping • Learning Rate scheduling |
| Output | Quantitative predictions + optional natural language descriptions |
| Resource | Description | Link |
|---|---|---|
| Trained Vision Transformer Model | Access to a pre-trained Vision Transformer model fine-tuned on synthetic spectrograms for chirp localization | HuggingFace Model Hub |
| Synthetic Spectrogram Dataset | Download link for 100,000 synthetic spectrograms with corresponding labels for chirp localization | HuggingFace Dataset Hub |
| PyTorch Implementation | Repository containing the PyTorch code for fine-tuning the Vision Transformer on spectrograms | Implementation GitHub Repository |
| Synthetic Chirp Generator | Python package for generating synthetic chirp spectrograms (images with corresponding labels) | Dataset GitHub Repository |
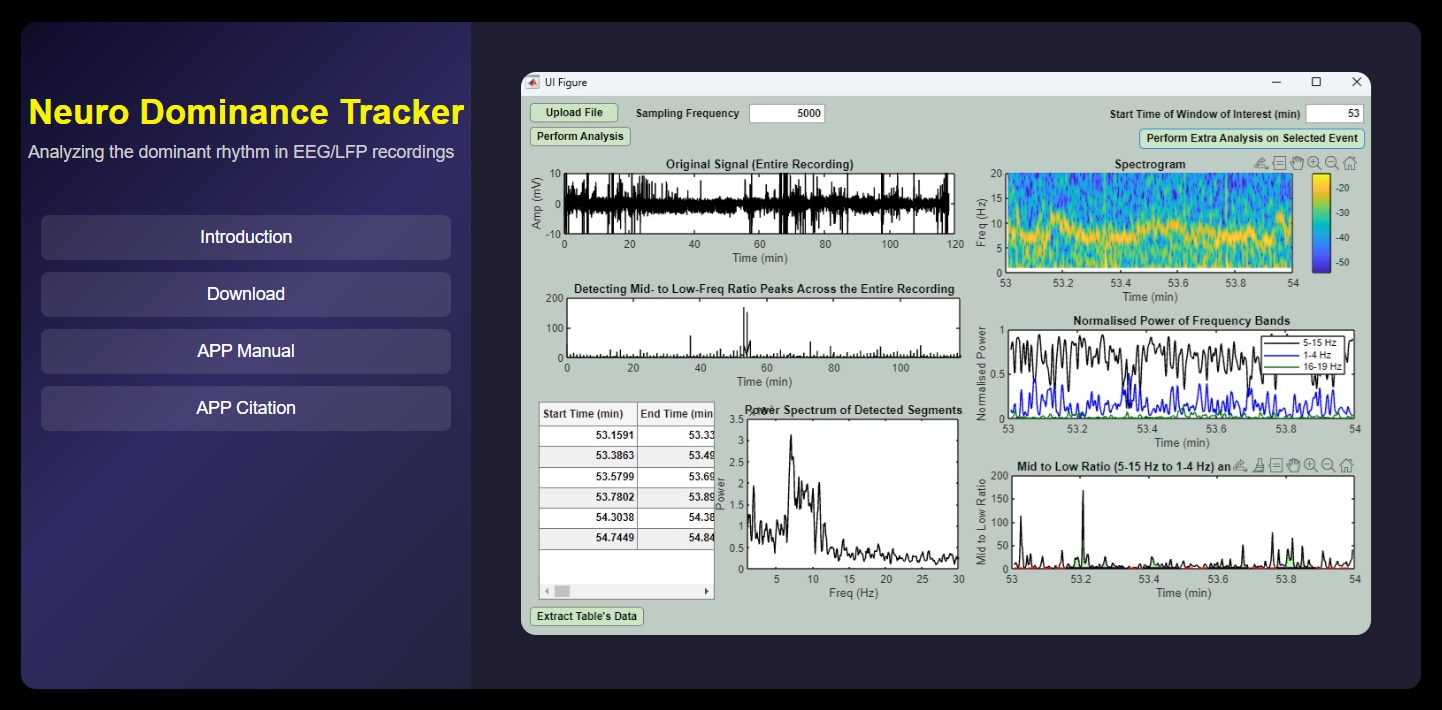
Neuro Dominance Tracker
A Software for Identification and Characterization of Dominant Rhythm in Neural Time Series (e.g., EEG, LFP)
Visit the Website
Citation
If you use this software in your research, please cite it as follows:
Bahador et al. (2025)
Step-by-Step Instructions for Analyzing Data using MATLAB App
1. Open MATLAB App
Launch the MATLAB App and wait for the App Designer window to appear.
Click on the “Run” button to open the user interface.
2. Upload Your File
Place the “fieldtrip-master” folder and the “abfload.m” script in the same directory as the NeuroDominanceTracker GUI executable.
Upload your file.
Enter the sampling frequency (e.g., 5000 Hz).
3. Perform Analysis
Click on the “Perform Analysis” button.
The app will analyze the recording in one-minute windows.
Messages will appear in the MATLAB command window for each window analyzed, indicating if a dominant mid-frequency is observed.
Wait for all windows to be analyzed (e.g., 118 windows for a sample two-hour recording).
4. View Results
Once analysis is complete, a table listing all identified episodes and their characteristics will be displayed.
You can extract this table as an Excel sheet by clicking the appropriate button.
5. Visualize Identified Events
Select an event and enter its corresponding minute (e.g., 109).
Click the button to visualize the selected event.
6. Time-Frequency Analysis
A spectrogram of the one-minute segment starting from the selected minute will be plotted.
The normalized power of mid, low, and high-frequency bands over time will be shown.
Dominant mid-frequency segments will be highlighted in green.
The power spectrum of the first dominant mid-frequency segment will be plotted.
7. Save Features
Click the button to save the features as an Excel file.
Sample EEG Data
The sample EDF (European Data Format) files used in this project were obtained from the following publication:
Brown, L. A., Hasan, S., Foster, R. G., & Peirson, S. N. (2016). The raw EEG data, 4 files (EEG_A to D), in European data format (.edf) [Data set]. Zenodo. Available at: Brown et al. (2016) Direct access to the data can be found here: Zenodo Record.
FieldTrip Toolbox
This project leverages the FieldTrip toolbox to support different file formats, including FIF, EDF, and BDF.
Reference:
Oostenveld, R., Fries, P., Maris, E., & Schoffelen, J.-M. (2011). FieldTrip: Open Source Software for Advanced Analysis of MEG, EEG, and Invasive Electrophysiological Data. Computational Intelligence and Neuroscience, 2011, 156869.
You can access the FieldTrip toolbox here: https://
- Bahador, N., Sengupta, S., Saha, J., Lankarany, M., Zhang, L., & Skinner, F. K. (2025). A Software for Identification and Characterization of Theta Rhythms in the Hippocampus. bioRxiv, 2025–03.
- Brown, L. A., Hasan, S., Foster, R. G., & Peirson, S. N. (2016). The Raw Eeg Data, 4 Files (Eeg_A To D), In European Data Format (.Edf). Zenodo. 10.5281/ZENODO.160118